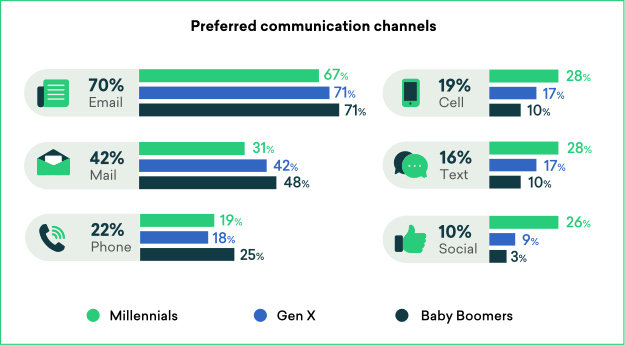
Back to Whitepapers
Providing excellent customer support is a challenge across all industries, but meeting that challenge is essential for success. That’s particularly true for retail businesses, where customer support teams serve as a direct line of contact between buyers and companies. Each interaction has the potential to make or break a sale, to drive repeat purchases, or form an opinion of your brand.
But at this point, retail store owners are well aware of the importance of great support. The challenge, then, is knowing what that support should look like, and whether your brand stacks up to both your competitors’ and your customers’ expectations. After all, without clear benchmarks, it can be difficult to know whether the level of customer support you provide is adequate (and, if not, where you have room for improvement).
At Freshdesk, we know that retailers strive to deliver the best possible shopping experiences to their customers. But considering how quickly customer support standards and consumer preferences can change, delivering top-notch experiences requires staying on top of trends and regularly evaluating your strategy. In this white paper, you’ll find benchmarks for key customer support metrics unique to retail. You’ll also find up-to-date information regarding customer preferences and support trends, along with our predictions for this industry in the coming years.
The information we’ve included is a combination of both our original research on customer support benchmarks, as well as data collected from other industry-leading publications. Our goal is that by the time you’ve finished reading this white paper, you’ll have the insight you need to adjust your strategy to better meet your customers’ needs and to take a more informed approach to serve them moving forward.
After experiencing bad service, 47% of consumers will no longer conduct business with the company and 45% will warn their friends and family about that brand. These metrics indicate that poor customer service has a clear and negative impact on both customer retention and brand reputation. Responses to good service, on the other hand, are almost the mirror opposite.
In response to good service, 55% of consumers will recommend a company to friends and family, and 47% will conduct more business with the company. It should come as no surprise, then, that support is a priority for today’s shoppers, with 63% of consumers reporting that good digital customer service is very important in their loyalty to a brand.
It’s also worth noting that for many of today’s shoppers, great support is more important than brand loyalty. In fact, 59% of American consumers1 say that they’d try a new brand or company for a better service experience. In this sense, customer support can be a crucial selling point for retailers — and a competitive advantage for those who provide it.
The easiest way to assess customer support metrics is by comparing them to past performance. And while this is an effective way to monitor improvement, it doesn’t tell you how the level of support you provide compares to what consumers experience with other businesses.
That’s why, in our Customer Happiness Benchmark Report, we examined anonymized user data on the support interactions of approximately 7,000 companies. In this analysis, we established concrete benchmarks for five of the most important customer support metrics: one-touch resolution, first response rate, resolution SLA, number of responses to resolution, and customer satisfaction. Then, we broke this data down by region to get a better idea of how customer support and consumer expectations vary around the world.
The average one-touch resolution, or first-call resolution (FCR), indicates how many tickets get resolved within the first response from a customer support team. This metric can give you a basic idea of the complexity of the inquiries your team receives, as a high one-touch resolution signals that your agents can resolve the average problem with a single message.
f there hasn’t been enough precedence for an issue to be documented but you’re sure it has happened before, look for it in your helpdesk. Search for it, and see how the agent on it handled it.
If it’s not a specific issue but a broader type of issue that you need help with, use filters to narrow down your search results and see what has been done by more experienced agents in the past. This way, you learn enough to smoothly resolve interactions with customers irrespective of whether you’ve found a solution.
Most companies have a service level agreement, or SLA, that lets customers know that they will resolve their issue within a specific period of time. This time varies by company but is used to give customers an accurate idea of when they can expect a response.
Across the companies in our study, 86% of tickets were resolved well within SLA. Knowing where your support team stands can help you determine whether they’re adequately equipped to meet the expectations you’re setting with customers.
Arguably the most important metric of all, the customer satisfaction metric indicates how many customers in our analysis reported that their interaction with a support agent was a positive one.
In this case, 78% of the customers in our study were happy with the service they received. So if your customer satisfaction score currently falls under this, you may have some work to do to catch up to your competitors.
And while a score at or above 78% indicates that your customer support is in fairly good standing, it’s important to remember that there’s always room for improvement — especially when those improvements can have a significant impact on customer retention and sales.
The five metrics above all represent worldwide averages of the data we collected. If you’re interested in data specific to your region, or simply want to learn how these metrics vary around the world, we’ve broken it down in the chart below.